Intro to Data Analysis
Node Red
Node Red is a flow-based coding tool. It has a web browser-based editor where you connect different nodes to retrieve data, store data, make decisions, etc. A common setup is to use the ‘mqtt in’ node to listen for messages/data. Then, based on the mqtt message content (JSON format), other nodes can be connected to store the data in a database, send data to gauges/charts, use a ‘mqtt out’ node to send instructions (publish) to another microcontroller. To program node-red you can use both the built-in nodes or code-blocks with custom javascript code/functions. Using json along with loads/dumps makes it easy to transfer data between Python running on your microcontroller and node-red js.
Although node-red is installed on RPi’s the node-red web site recommends using their script to setup on a RPi.
sudo apt install build-essential git
bash <(curl -sL https://raw.githubusercontent.com/node-red/linux-installers/master/deb/update-nodejs-and-nodered)
On Pi Node-RED works better with the Firefox or Chrome browser
node-red-stop to stop Node-RED
node-red-start to start Node-RED again
node-red-log to view the recent log output
sudo systemctl enable nodered to autostart Node-RED at every boot
sudo systemctl disable nodered to disable autostart on boot
sudo reboot
To setup your node red flows go to http://hostname.local:1880 (IP add = the address of RPi) on any device connected to the network.
For influxdb and gauges/charts options go to menu in upper right and “manage pallette” then install
- influxdb
- node red dashboard
Dashboard
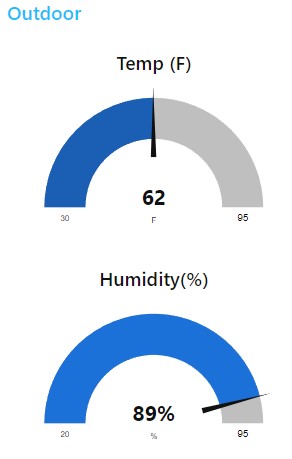
Once you have gauges/charts setup you can view them at http://hostname.local:1880/ui


Grafana
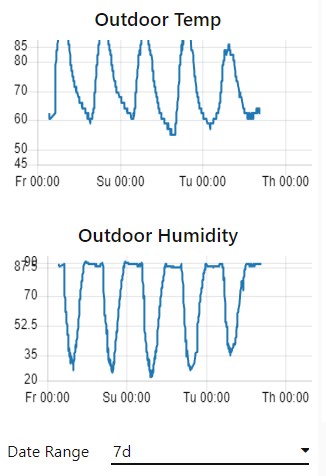
Most of the graphing I do is in node-red because it’s convenient to setup while working on the main flow and the graphs are compact (look nice on mobile browser). But grafana is useful when you want the ability to zoom in closer and do more analysis. It also has functions to alert you based on conditions you configure.
Installation
Prerequisites
sudo apt-get install -y apt-transport-https
sudo apt-get install -y software-properties-common wget
Add APT key used for authenticating the grafana package
wget -q -O - https://packages.grafana.com/gpg.key | sudo apt-key add - Add the grafana repository to your sources.list echo “deb https://packages.grafana.com/oss/deb stable main” | sudo tee -a /etc/apt/sources.list.d/grafana.list Download package information from the updated sources and install grafana sudo apt update sudo apt install grafana Start the grafana server and enable it to start on boot sudo systemctl start grafana-server sudo systemctl enable grafana-server Grafana runs on port 3000 so you can configure your database by going to http://hostname.local:3000 Initial login is admin/admin. Configuration file is in /etc/grafana/grafana.ini
Add your first data source (influxDB)
InfluxQL
URL: http://localhost:8086
Add a database
Save and Test
Create/add panels in your dashboard
Click on the title and edit (example below)
FROM autogen mydb WHERE device = mcp3008
SELECT field (a0f)
On far right click "Show options" and then Visualation drop down to change graph type to gauge or bar, etc.
Upper right in the referesh bar you can select 5s auto refresh (can't go smaller).
Adding plugin panels (ie plotly) To avoid write permissions I used sudo which forced chown/chmod on the plugin files. There is a better way to do this.. but this is what worked for me. $ sudo grafana-cli plugins install